

Overview
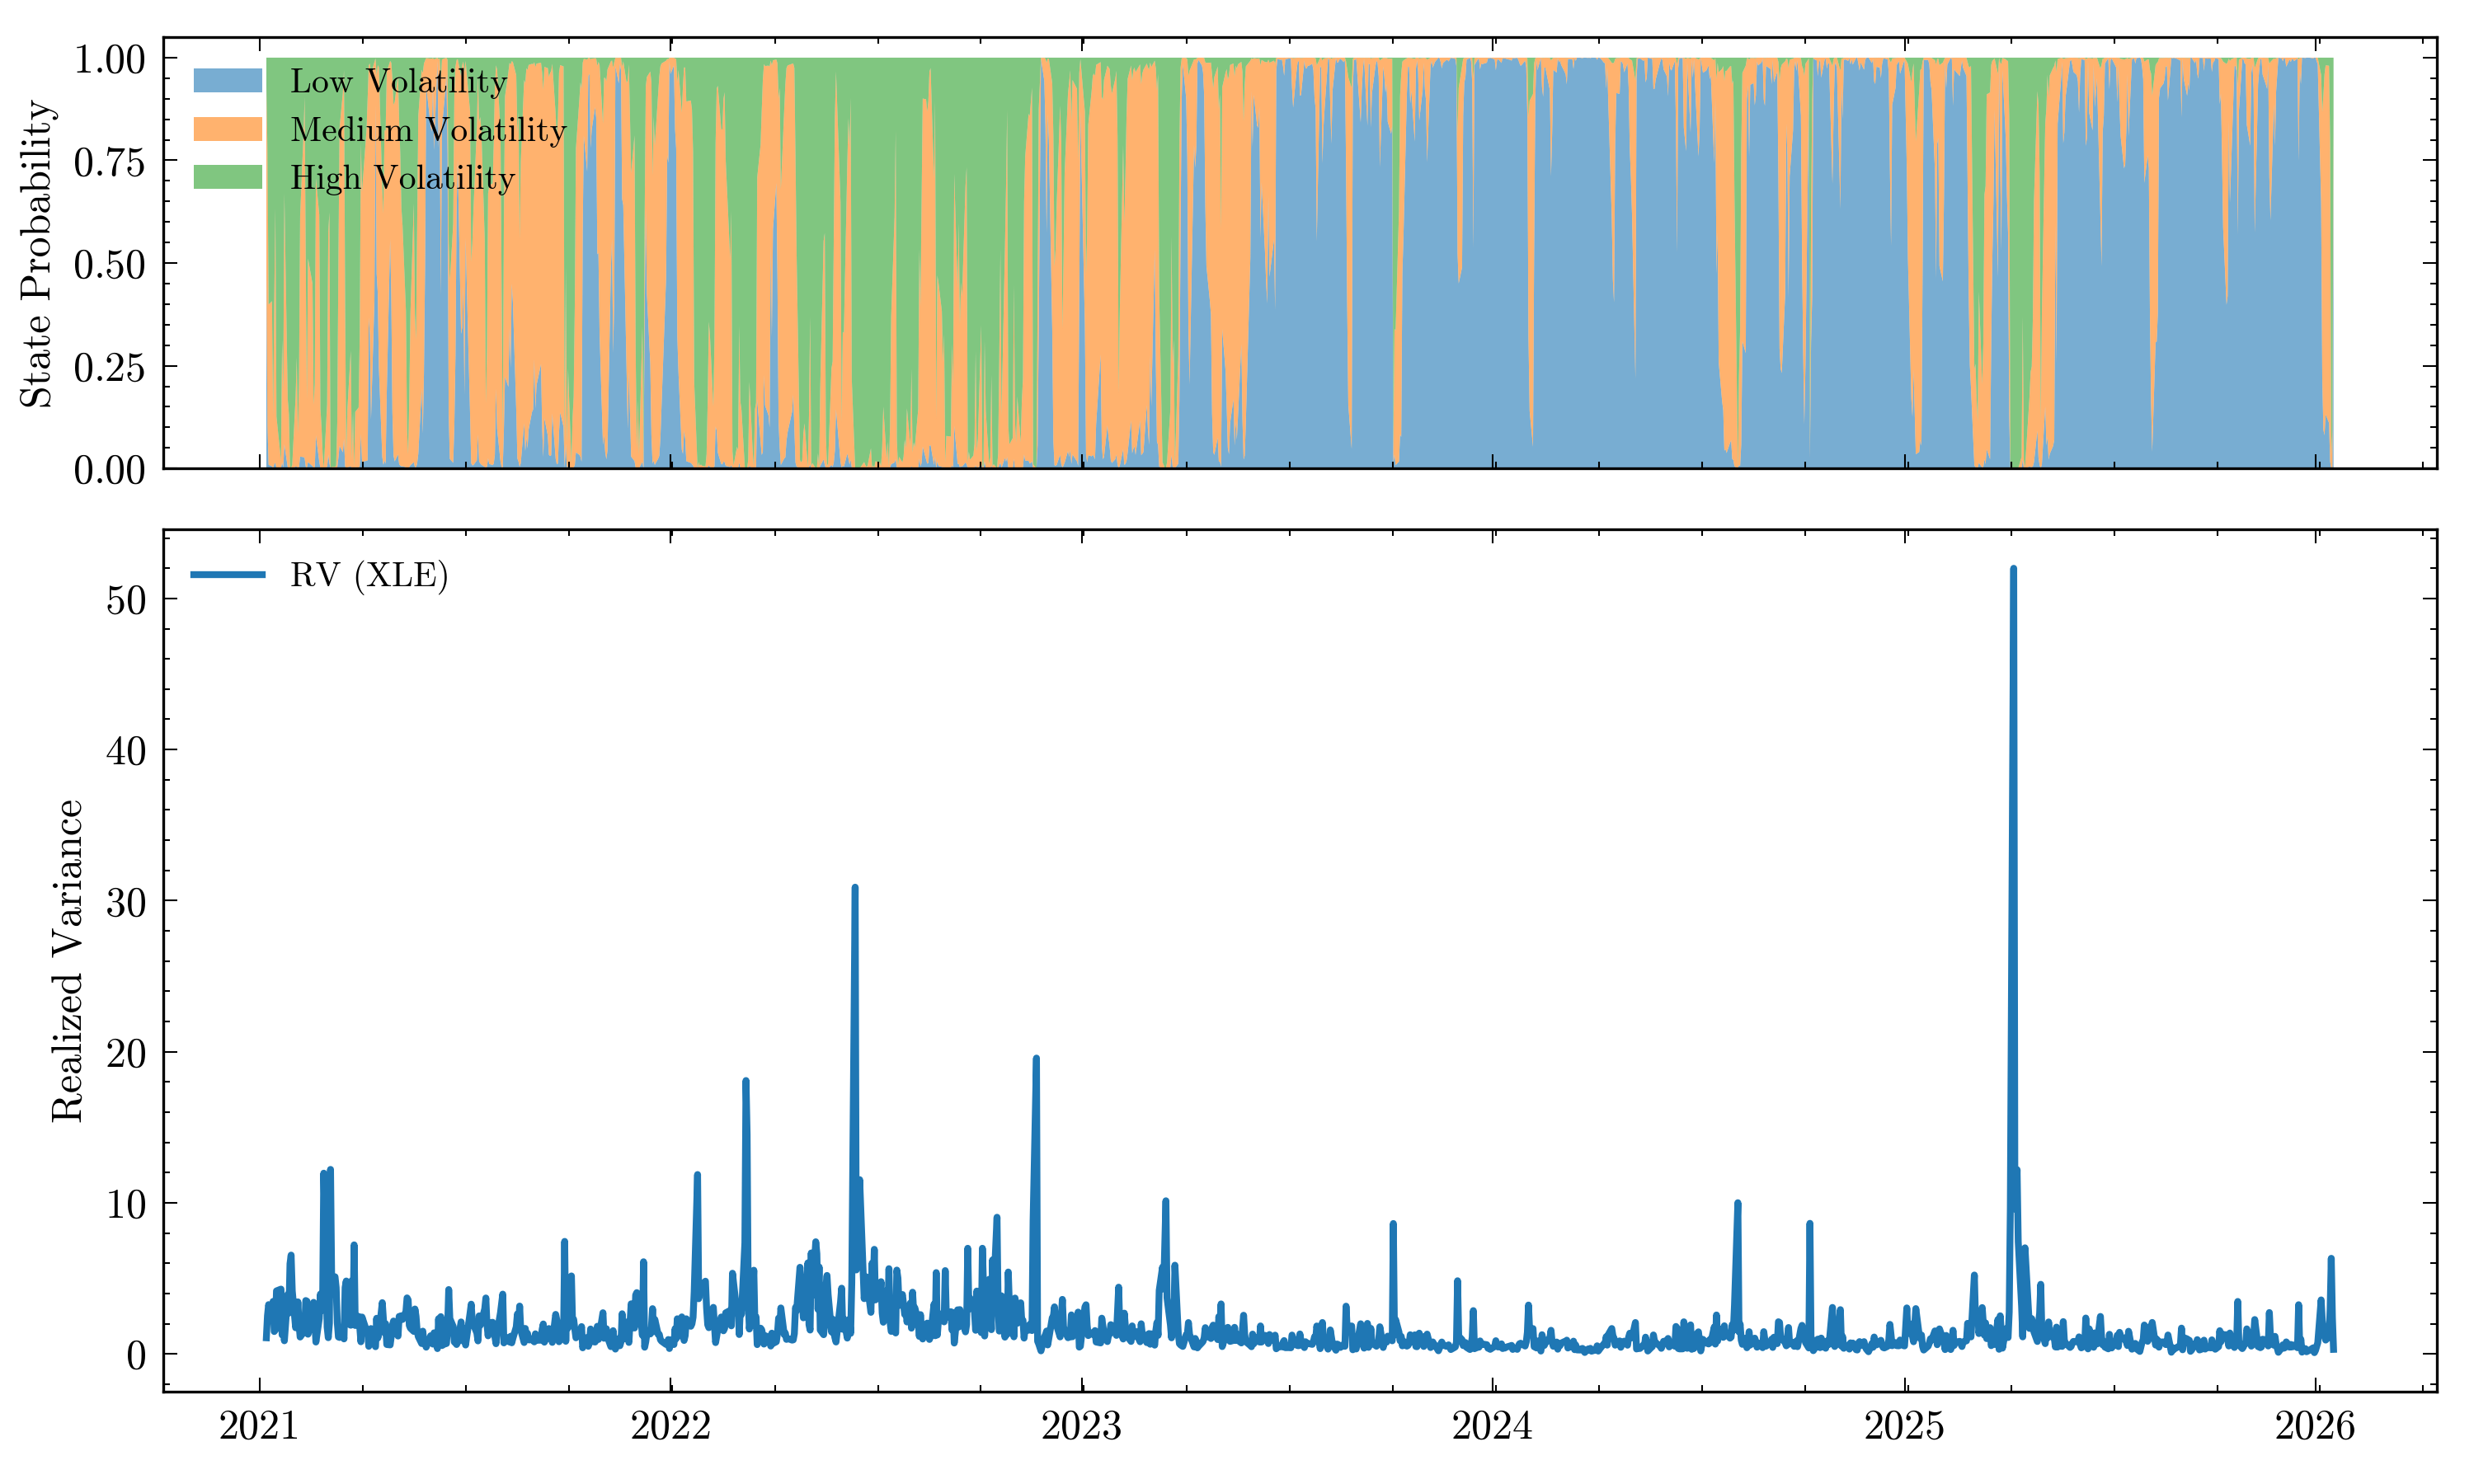
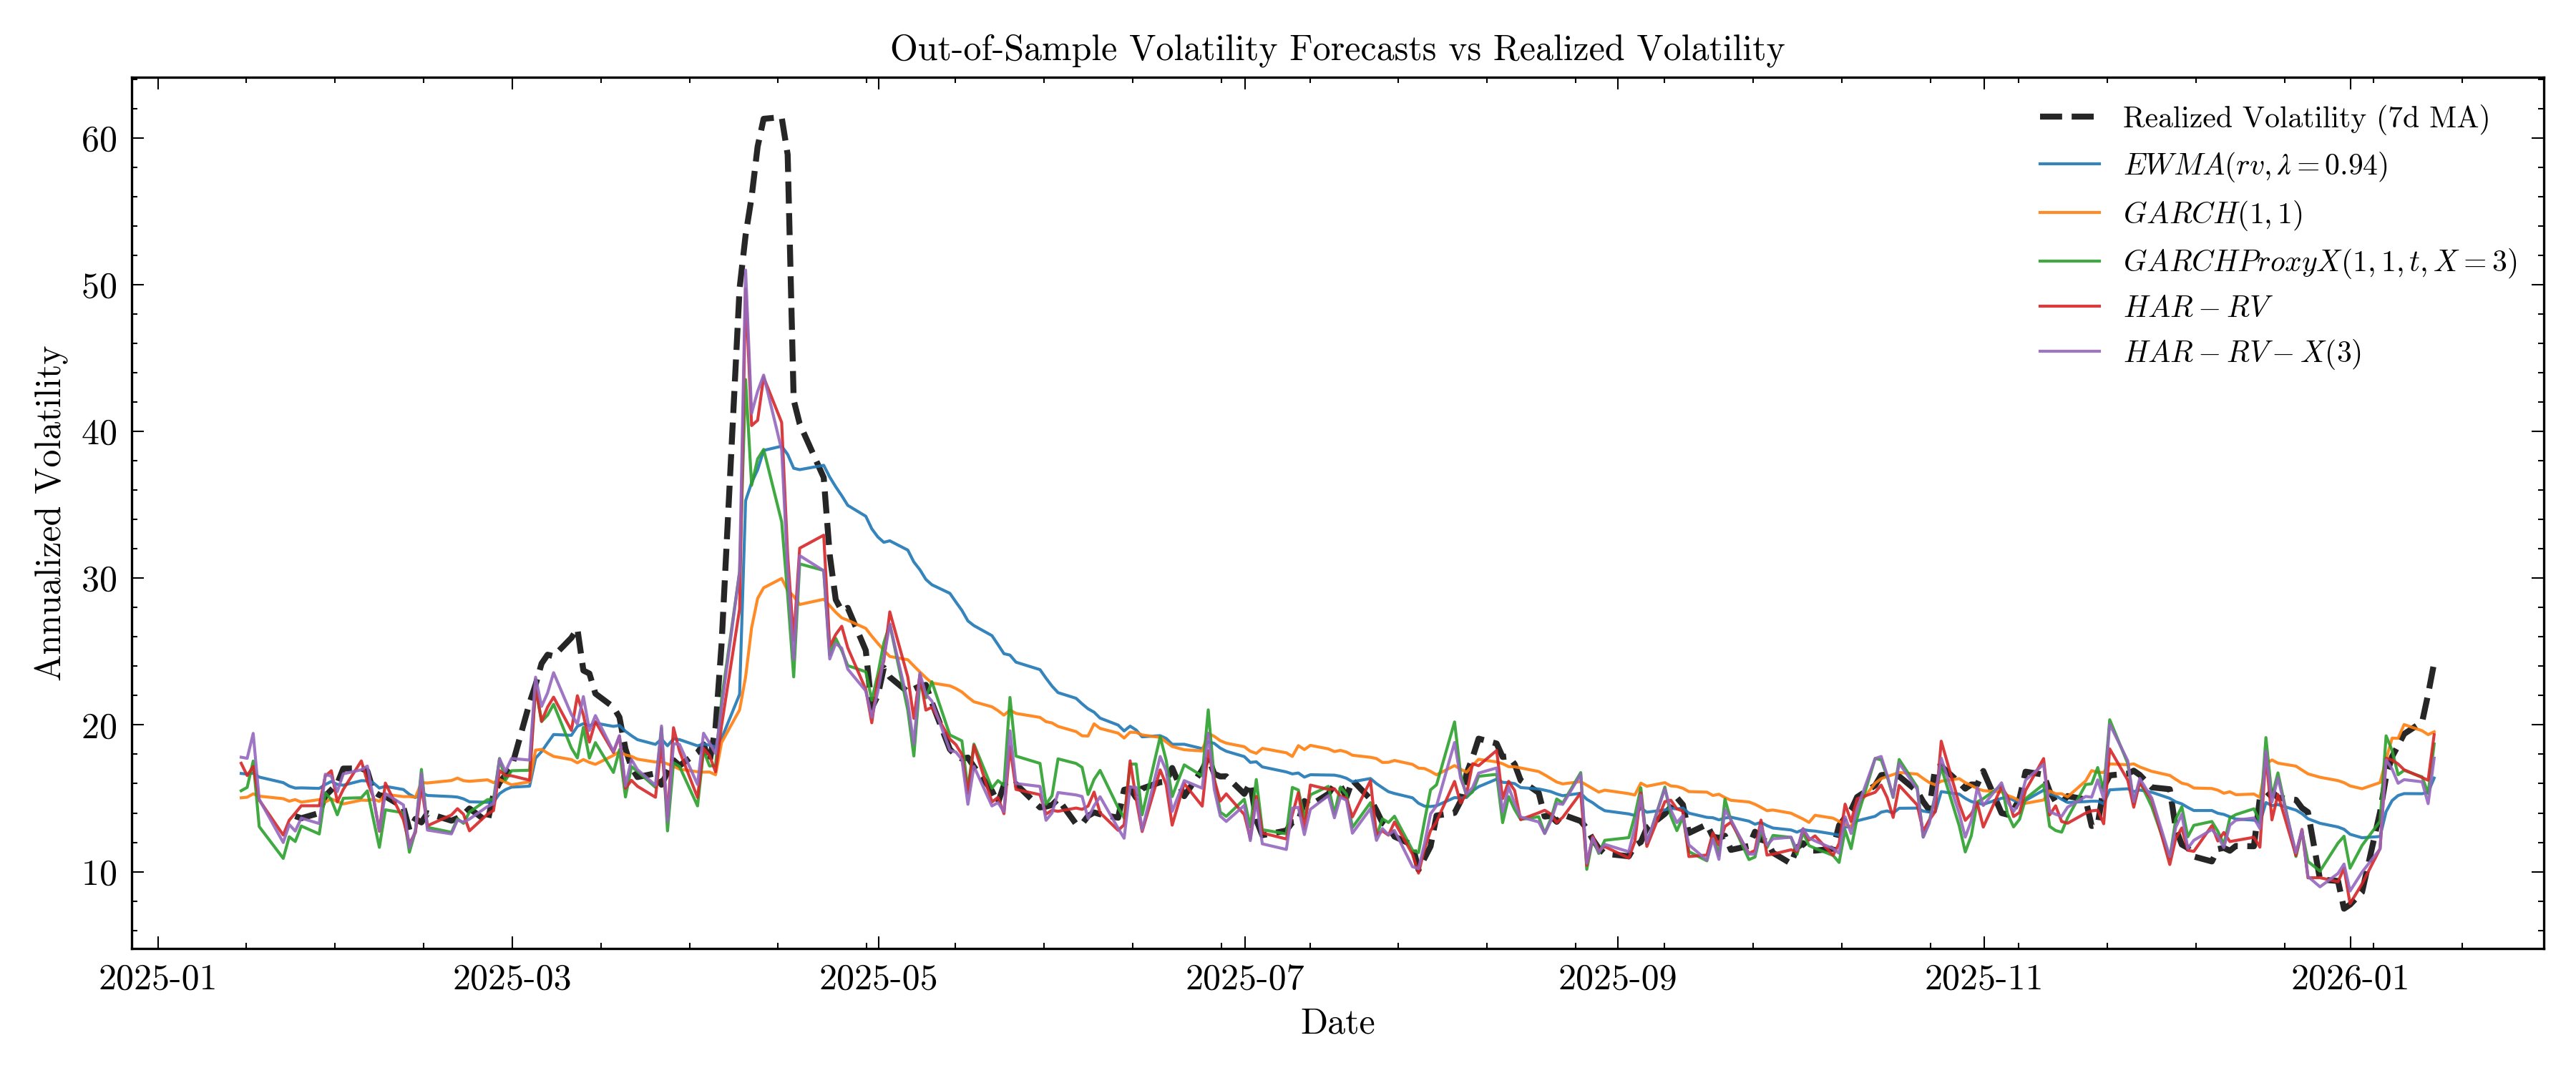
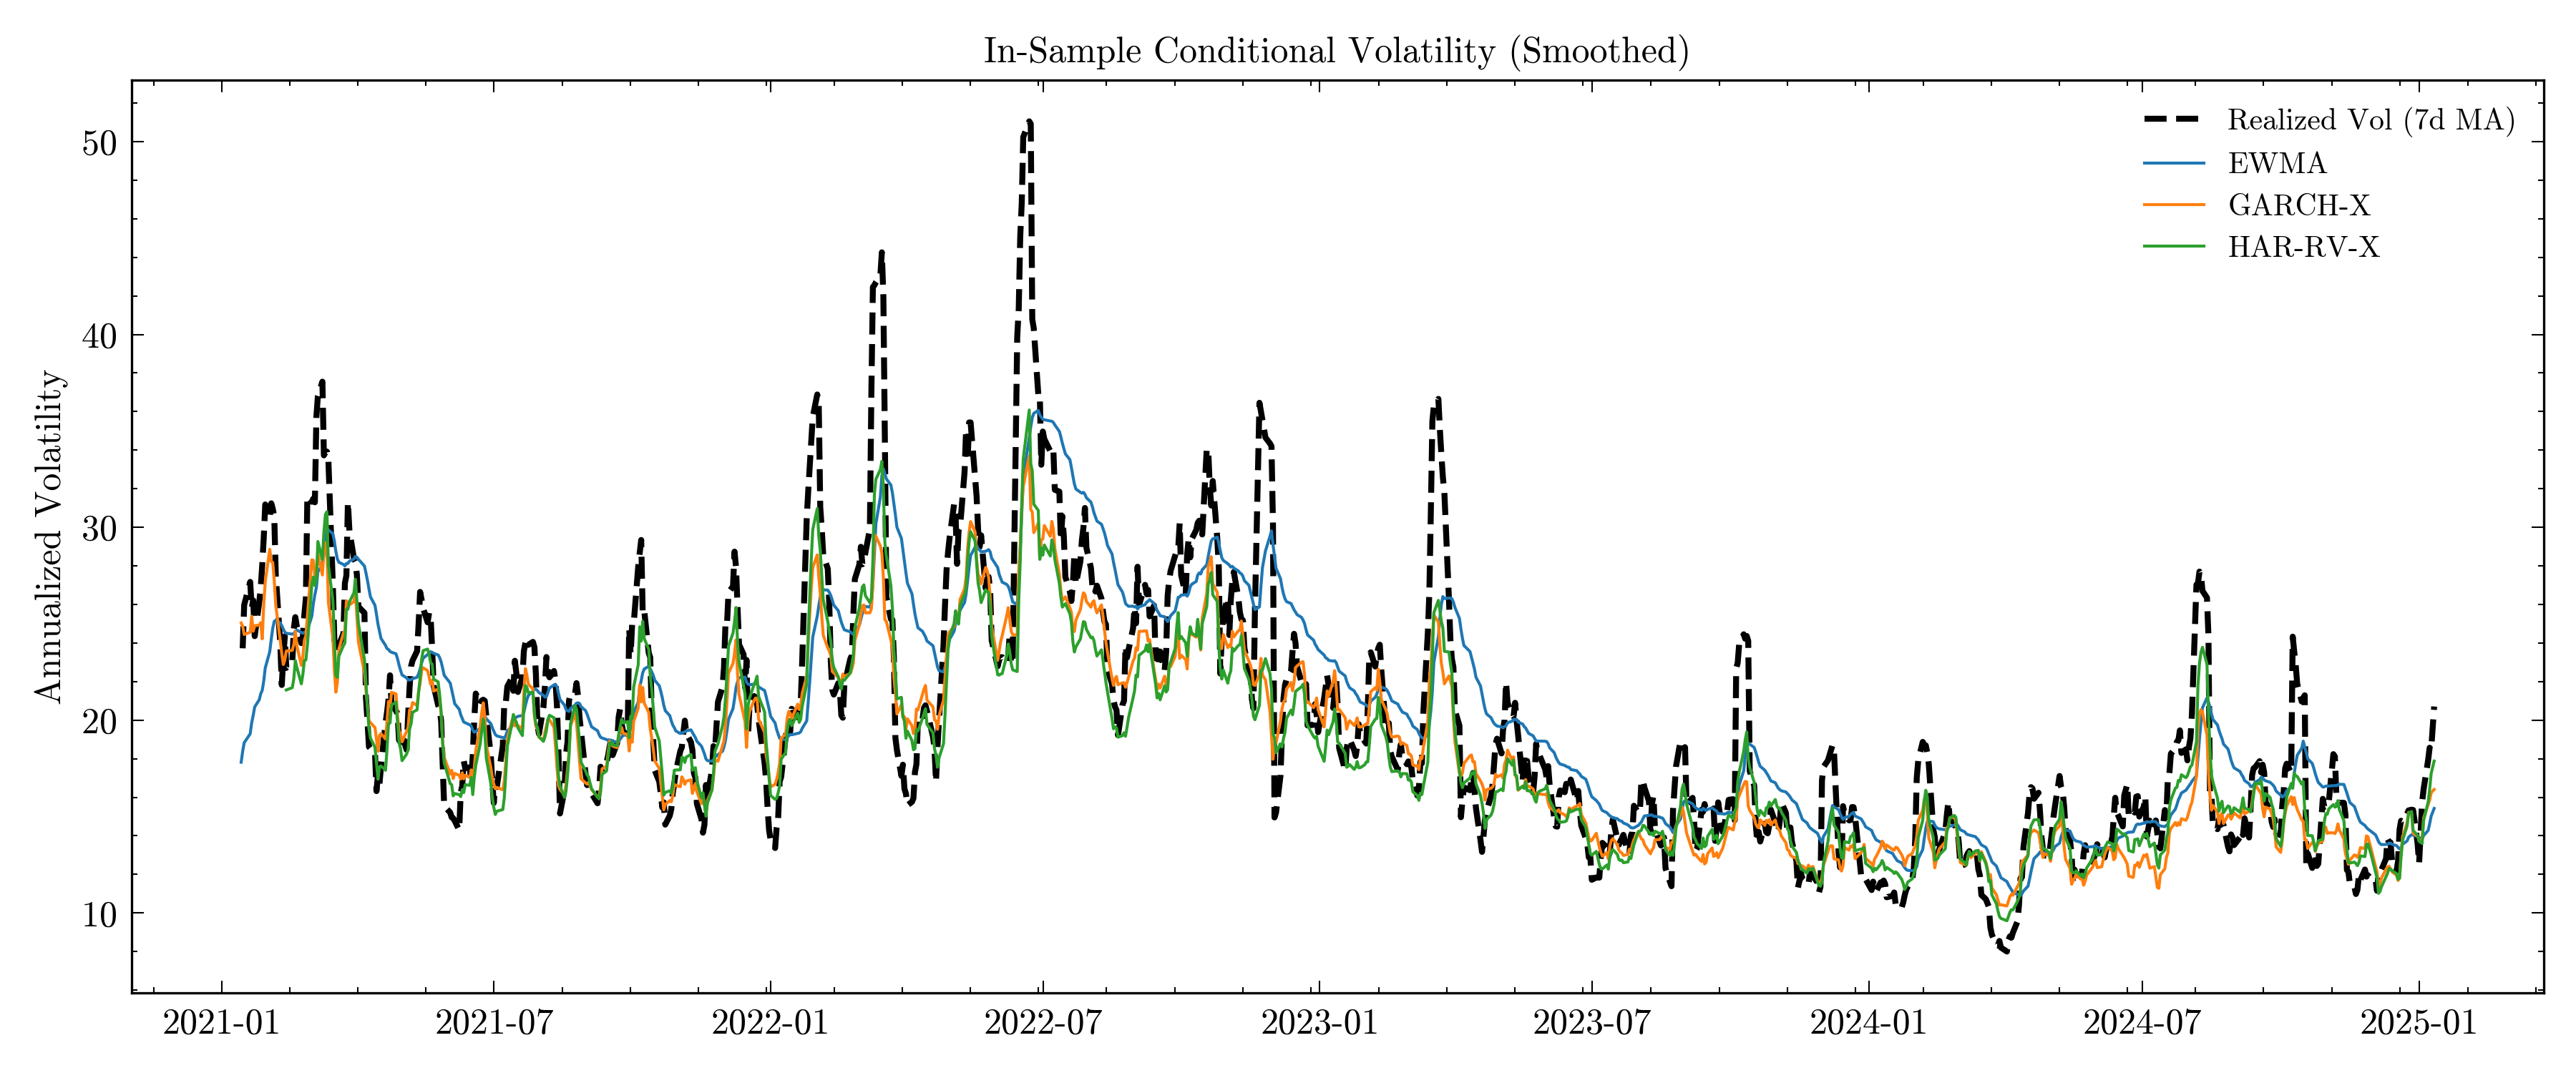
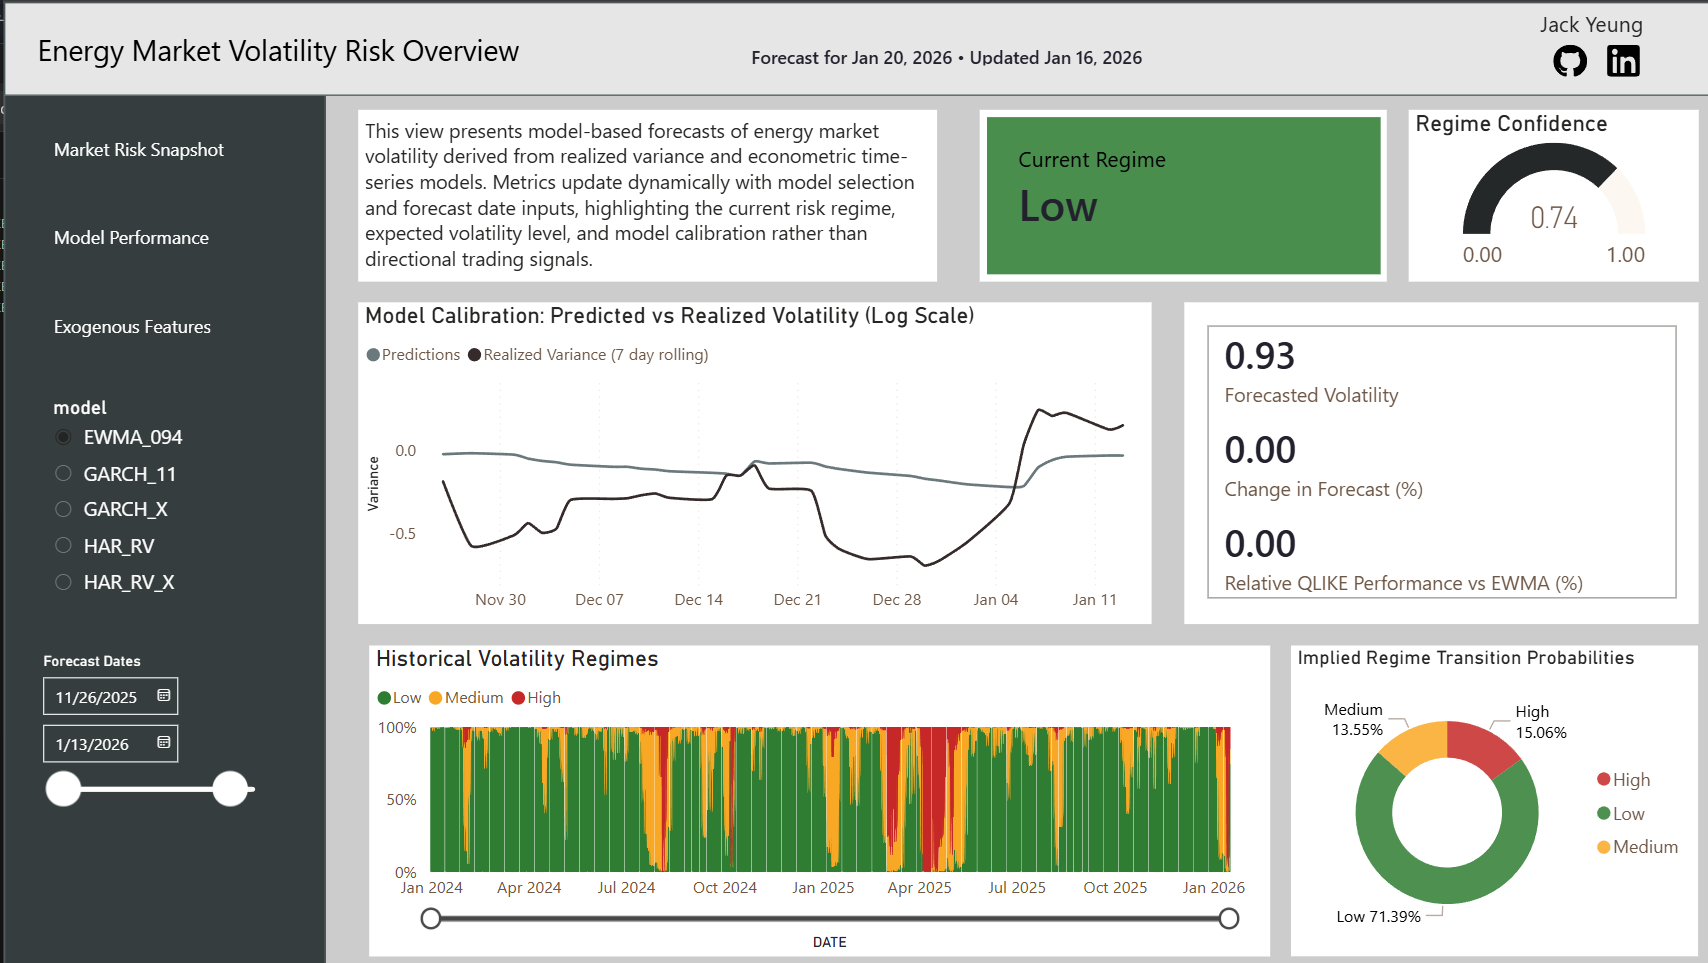
I built an end-to-end system to forecast and monitor energy-sector volatility (XLE) using econometric models and regime-switching dynamics, deployed in a fully automated cloud environment. The project integrates financial, macroeconomic, and exogenous data to support daily risk assessment and volatility-conditioned decision making.
Originally developed for a Financial Econometrics course, the system was extended into a production-style pipeline with automated retraining, evaluation, and dashboarding.
Data & Features
- Market data: intraday prices (15-minute bars) to compute realized variance
- Macroeconomic signals: interest rates, volatility indices (VIX, OVX), energy prices
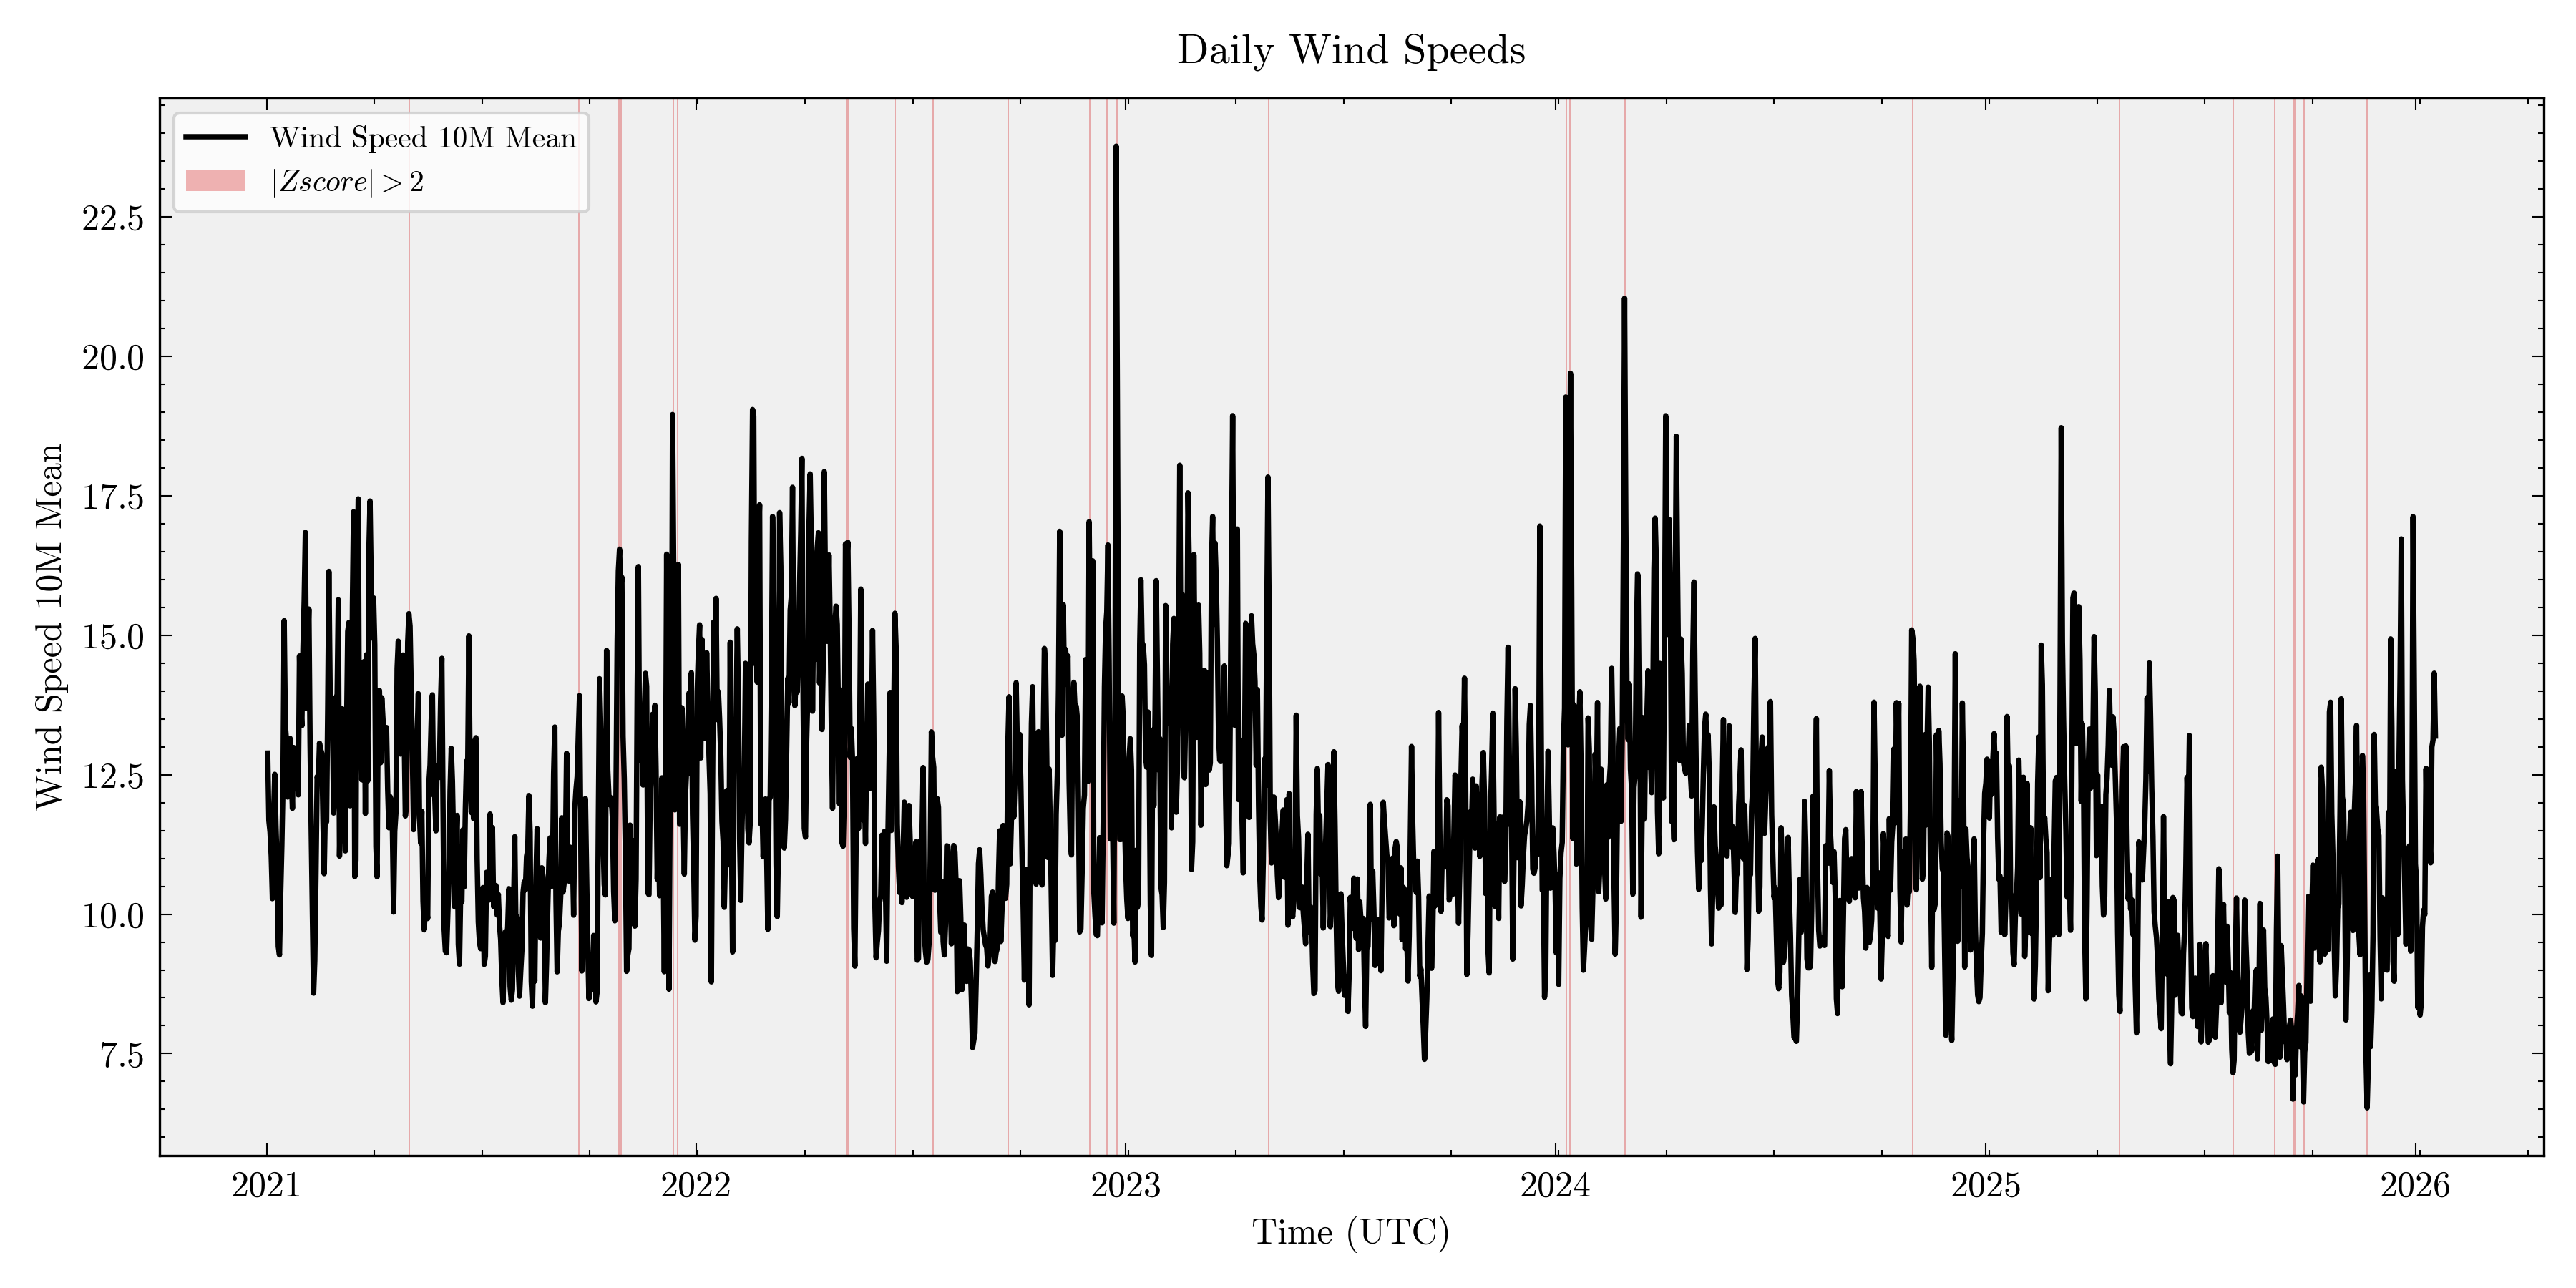
- Exogenous features: weather anomaly z-scores and extreme-event flags
All data is versioned and stored in a bronze / silver / gold S3 data-lake structure for reproducibility.
Modeling
I implemented and benchmarked multiple econometric volatility models:
- EWMA
- GARCH
- HAR-RV
Models are retrained on rolling windows and evaluated strictly out-of-sample using QLIKE. To capture structural changes in volatility, I added a Markov regime-switching model to infer latent Low / Medium / High volatility states and track regime persistence and transition risk.
System & Deployment
- Dockerized pipelines on AWS ECS Fargate
- EventBridge for scheduled daily execution
- S3, Glue, and Athena for analytics-ready storage
- Power BI dashboards for forecasts, regimes, and performance metrics
The system runs fully automatically and produces daily, versioned outputs for risk monitoring.
Tools: Python, Pandas, Statsmodels, AWS (S3, ECS, EventBridge, Glue, Athena), Docker, Power BI
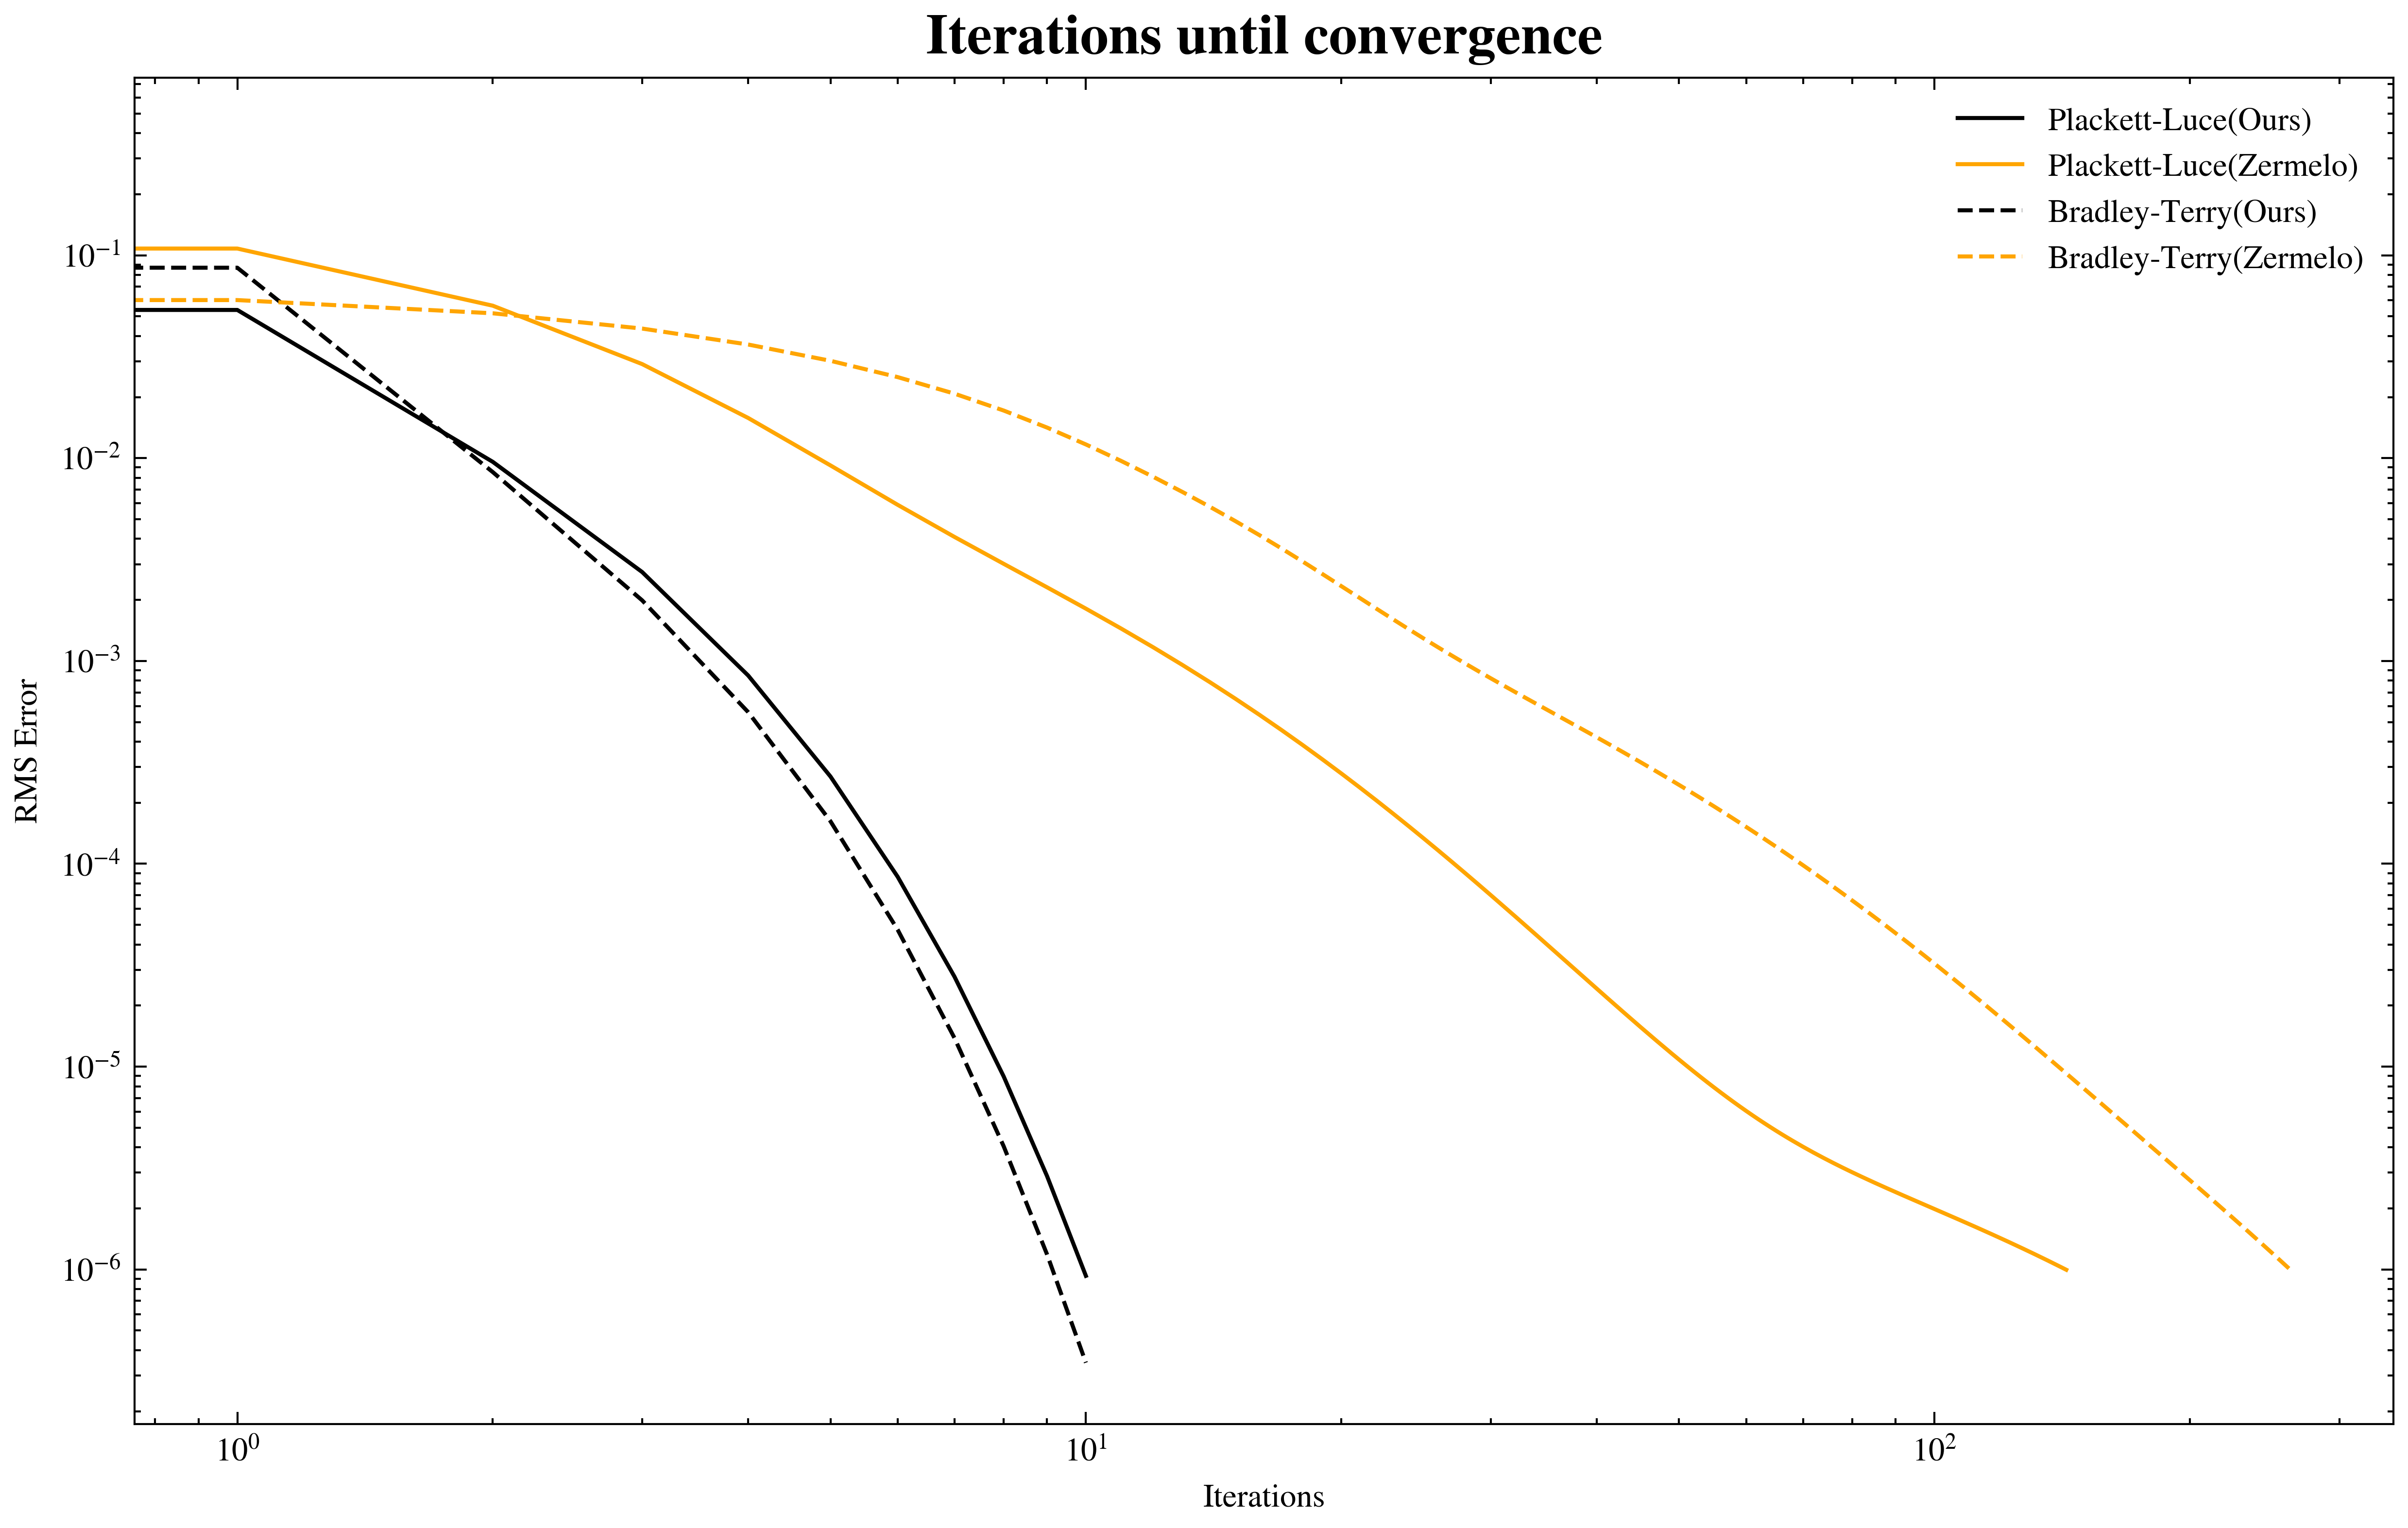

This paper presents a generalization of the efficient iterative update originally developed by Mark Newman for the Bradley-Terry (BT) model, extending it from pairwise comparisons to multi-entity interactions under the Plackett-Luce framework. The Bradley-Terry model, which is closely related to the Elo rating system used in chess, provides a probabilistic approach for estimating latent player or entity strength.
Two-Entity vs. Multi-Entity Interactions
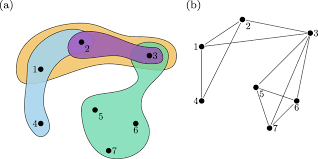
Two-entity interactions involve head-to-head comparisons between two players, teams, or items, such as soccer matches or boxing bouts. In contrast, multi-entity interactions arise in settings where outcomes involve more than two participants, including Formula One races, ranked-choice competitions, and tournament-style events.
Extending the Bradley-Terry Model
To support higher-order interactions, the framework leverages hypergraphs, which generalize traditional graphs by allowing edges to connect multiple entities. The likelihood function is reformulated accordingly, enabling the efficient iterative structure of the Bradley-Terry model to be preserved under multi-body settings. This extension allows for faster and more scalable estimation of entity strength in complex competitive environments.
The proposed method was evaluated using both real-world preference data and synthetically generated datasets, providing a comprehensive assessment of its performance and robustness.
End-To-End Machine Learning Apartment Price Prediction Model
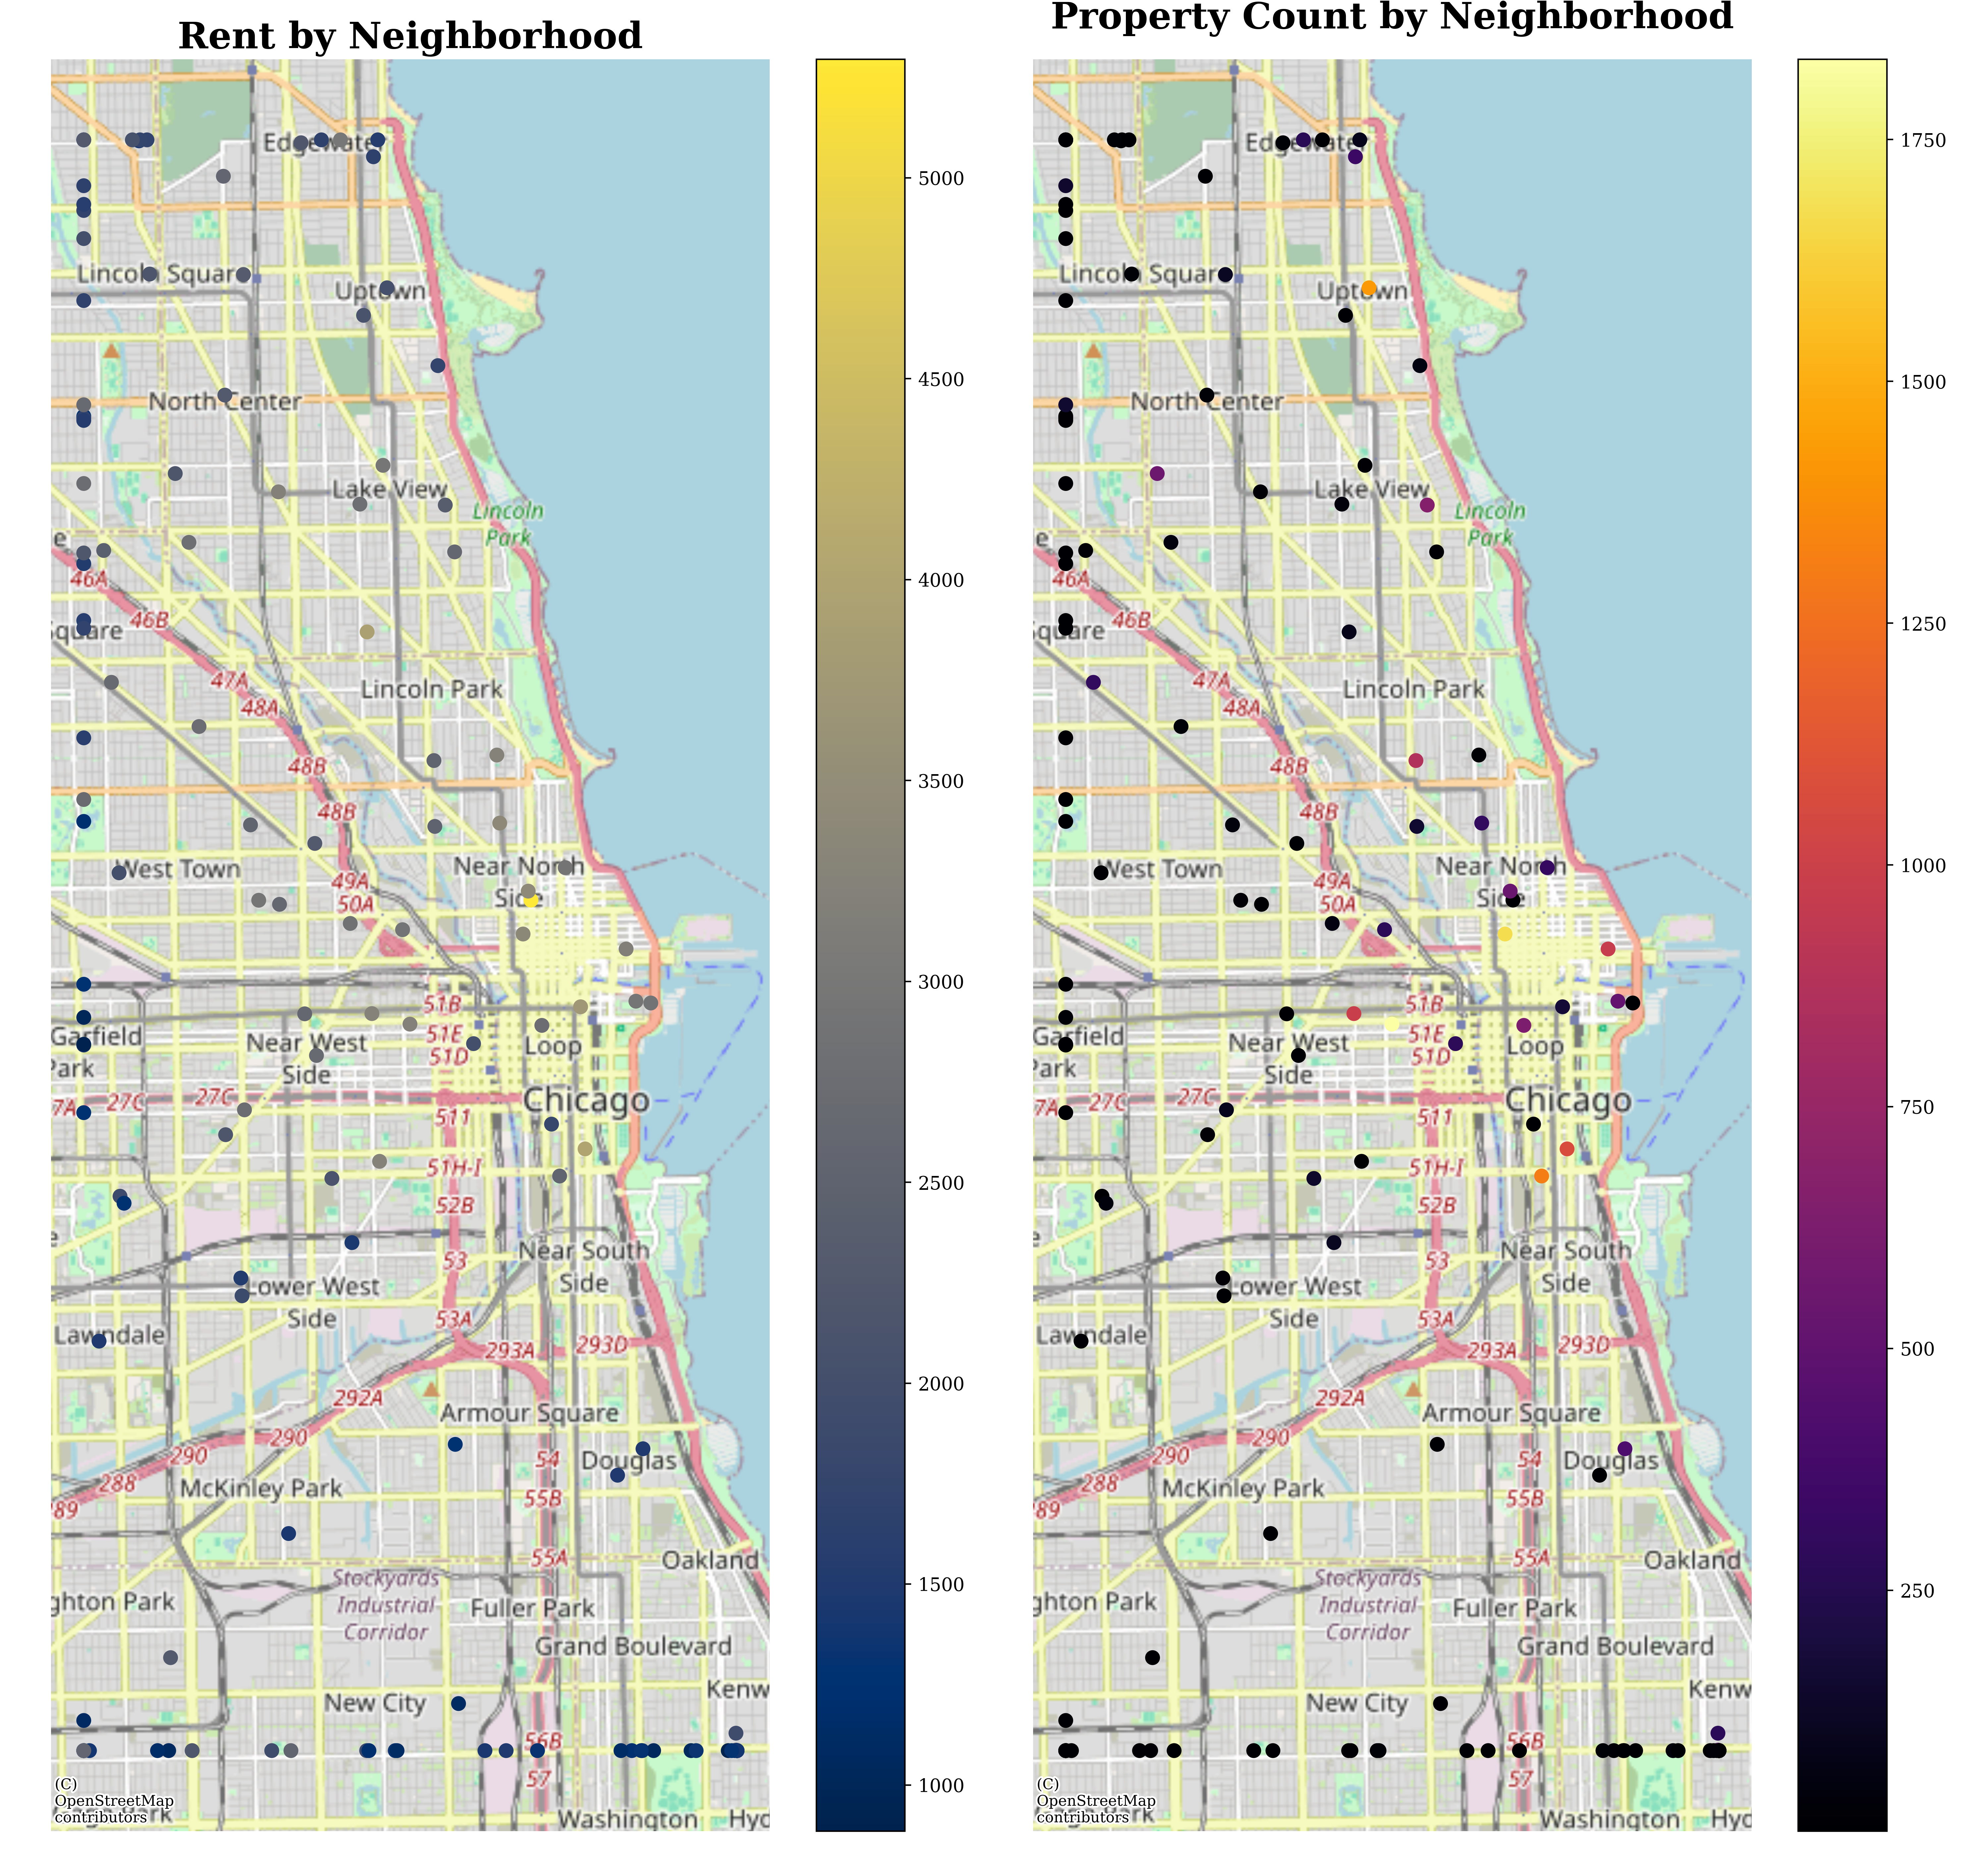
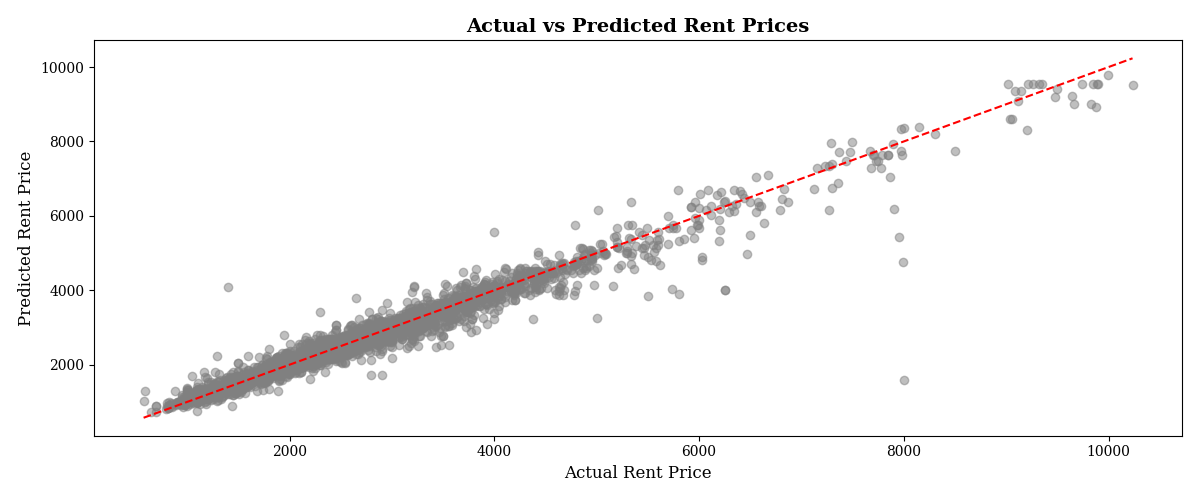
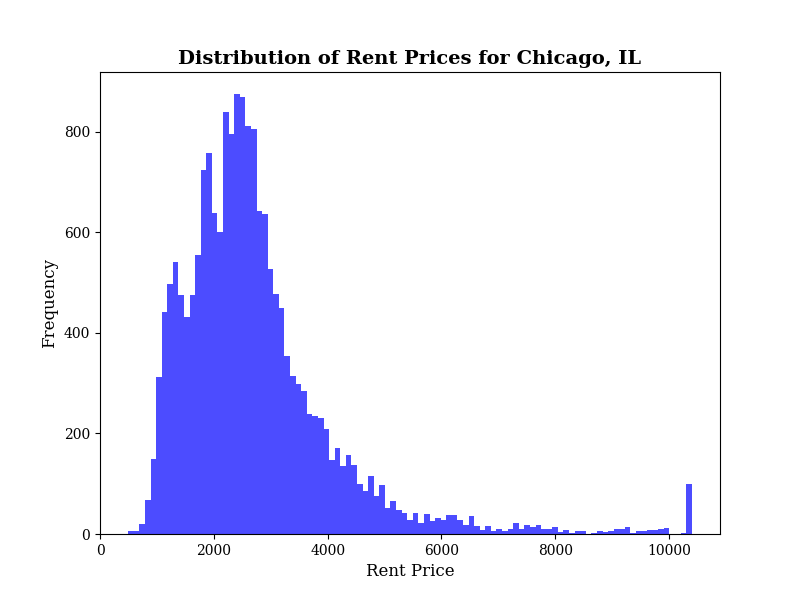
This project was composed of two primary components: data engineering and machine learning modeling.
Data Engineering
I designed and implemented an end-to-end data pipeline to collect publicly available apartment listings through web scraping. Automated bots were developed to extract and parse HTML content for listings within a target city, with the resulting data stored in structured JSON files. To support scalable and reliable analysis, I designed an Entity-Relationship Diagram (ERD) and implemented a SQLite3 relational database. Data integrity and schema consistency were enforced using Pydantic validation, ensuring high-quality inputs for downstream modeling.
Machine Learning Modeling & Analysis
The second phase focused on exploratory analysis and predictive modeling. Through Exploratory Data Analysis (EDA), I identified key trends as well as common challenges associated with noisy, real-world housing data. I then developed and evaluated three predictive models:
- XGBoost (Extreme Gradient Boosted Trees)
- Feedforward Neural Network
- Lasso Regression
Due to the limited availability of structured numerical features from HTML listings, I enhanced model performance by incorporating text-based information. Amenity descriptions were transformed into numerical features using TF-IDF (Term Frequency–Inverse Document Frequency). This feature engineering strategy resulted in a 55% reduction in average squared error, substantially improving predictive accuracy.
Distributed Matrix Multiplication with Map-Reduce on GCP
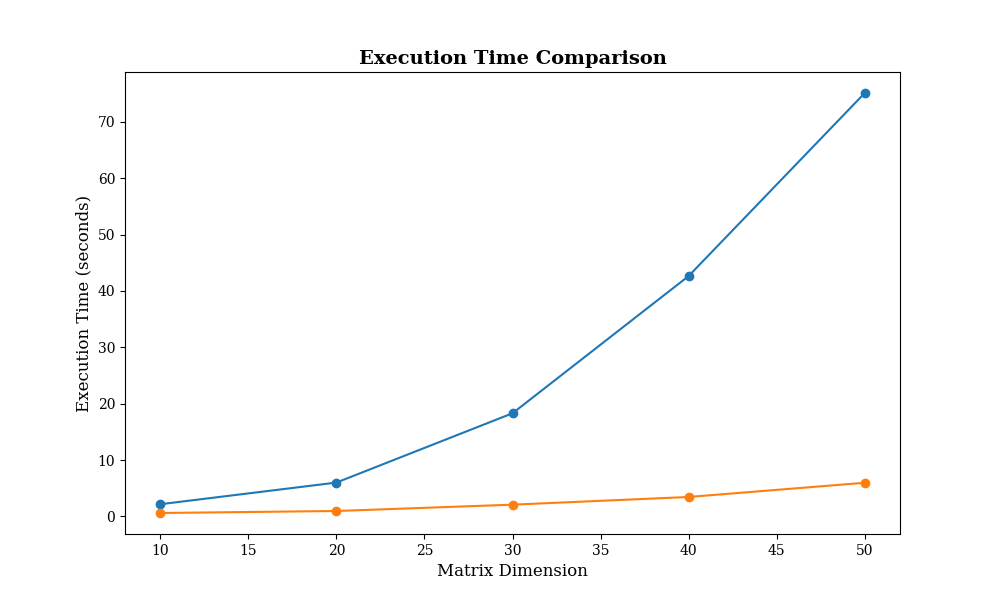
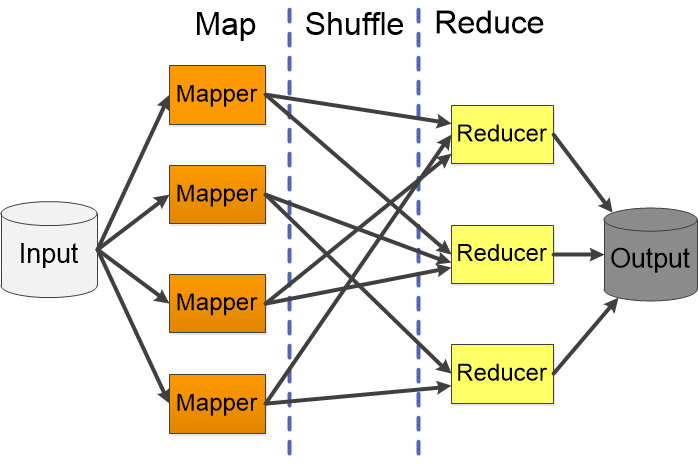
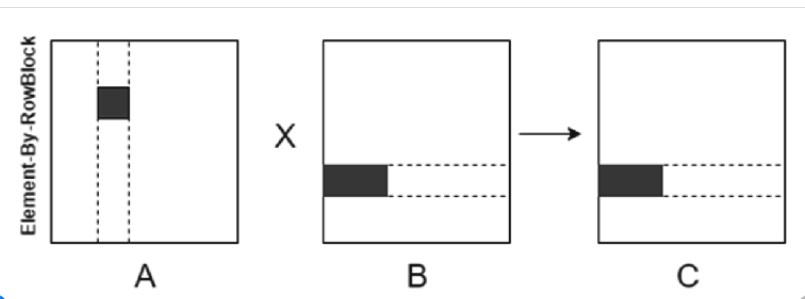
As machine learning workloads continue to grow in scale and complexity, efficient computation has become increasingly critical. In the Engineering Cloud Computing course, I was tasked with leveraging Google’s MapReduce architecture to distribute computational workloads across multiple virtual machines.
Project Overview
To study the performance benefits of distributed computing, I identified and replicated a research paper evaluating alternative matrix multiplication schemes. This required designing an orchestration framework capable of partitioning large matrices into smaller submatrices and coordinating their execution efficiently.
Implementation on Google Cloud Platform
Each matrix was decomposed into appropriately sized chunks, with pairs of submatrices dispatched to Google Cloud Platform (GCP) serverless functions for parallel computation. The partial results were then aggregated to reconstruct the final matrix. This approach demonstrated the scalability of serverless architectures for large-scale numerical workloads and achieved an average 8× speedup compared to standard matrix multiplication on GCP.
Image Classifier using CNN (Convolutional Neural Network)
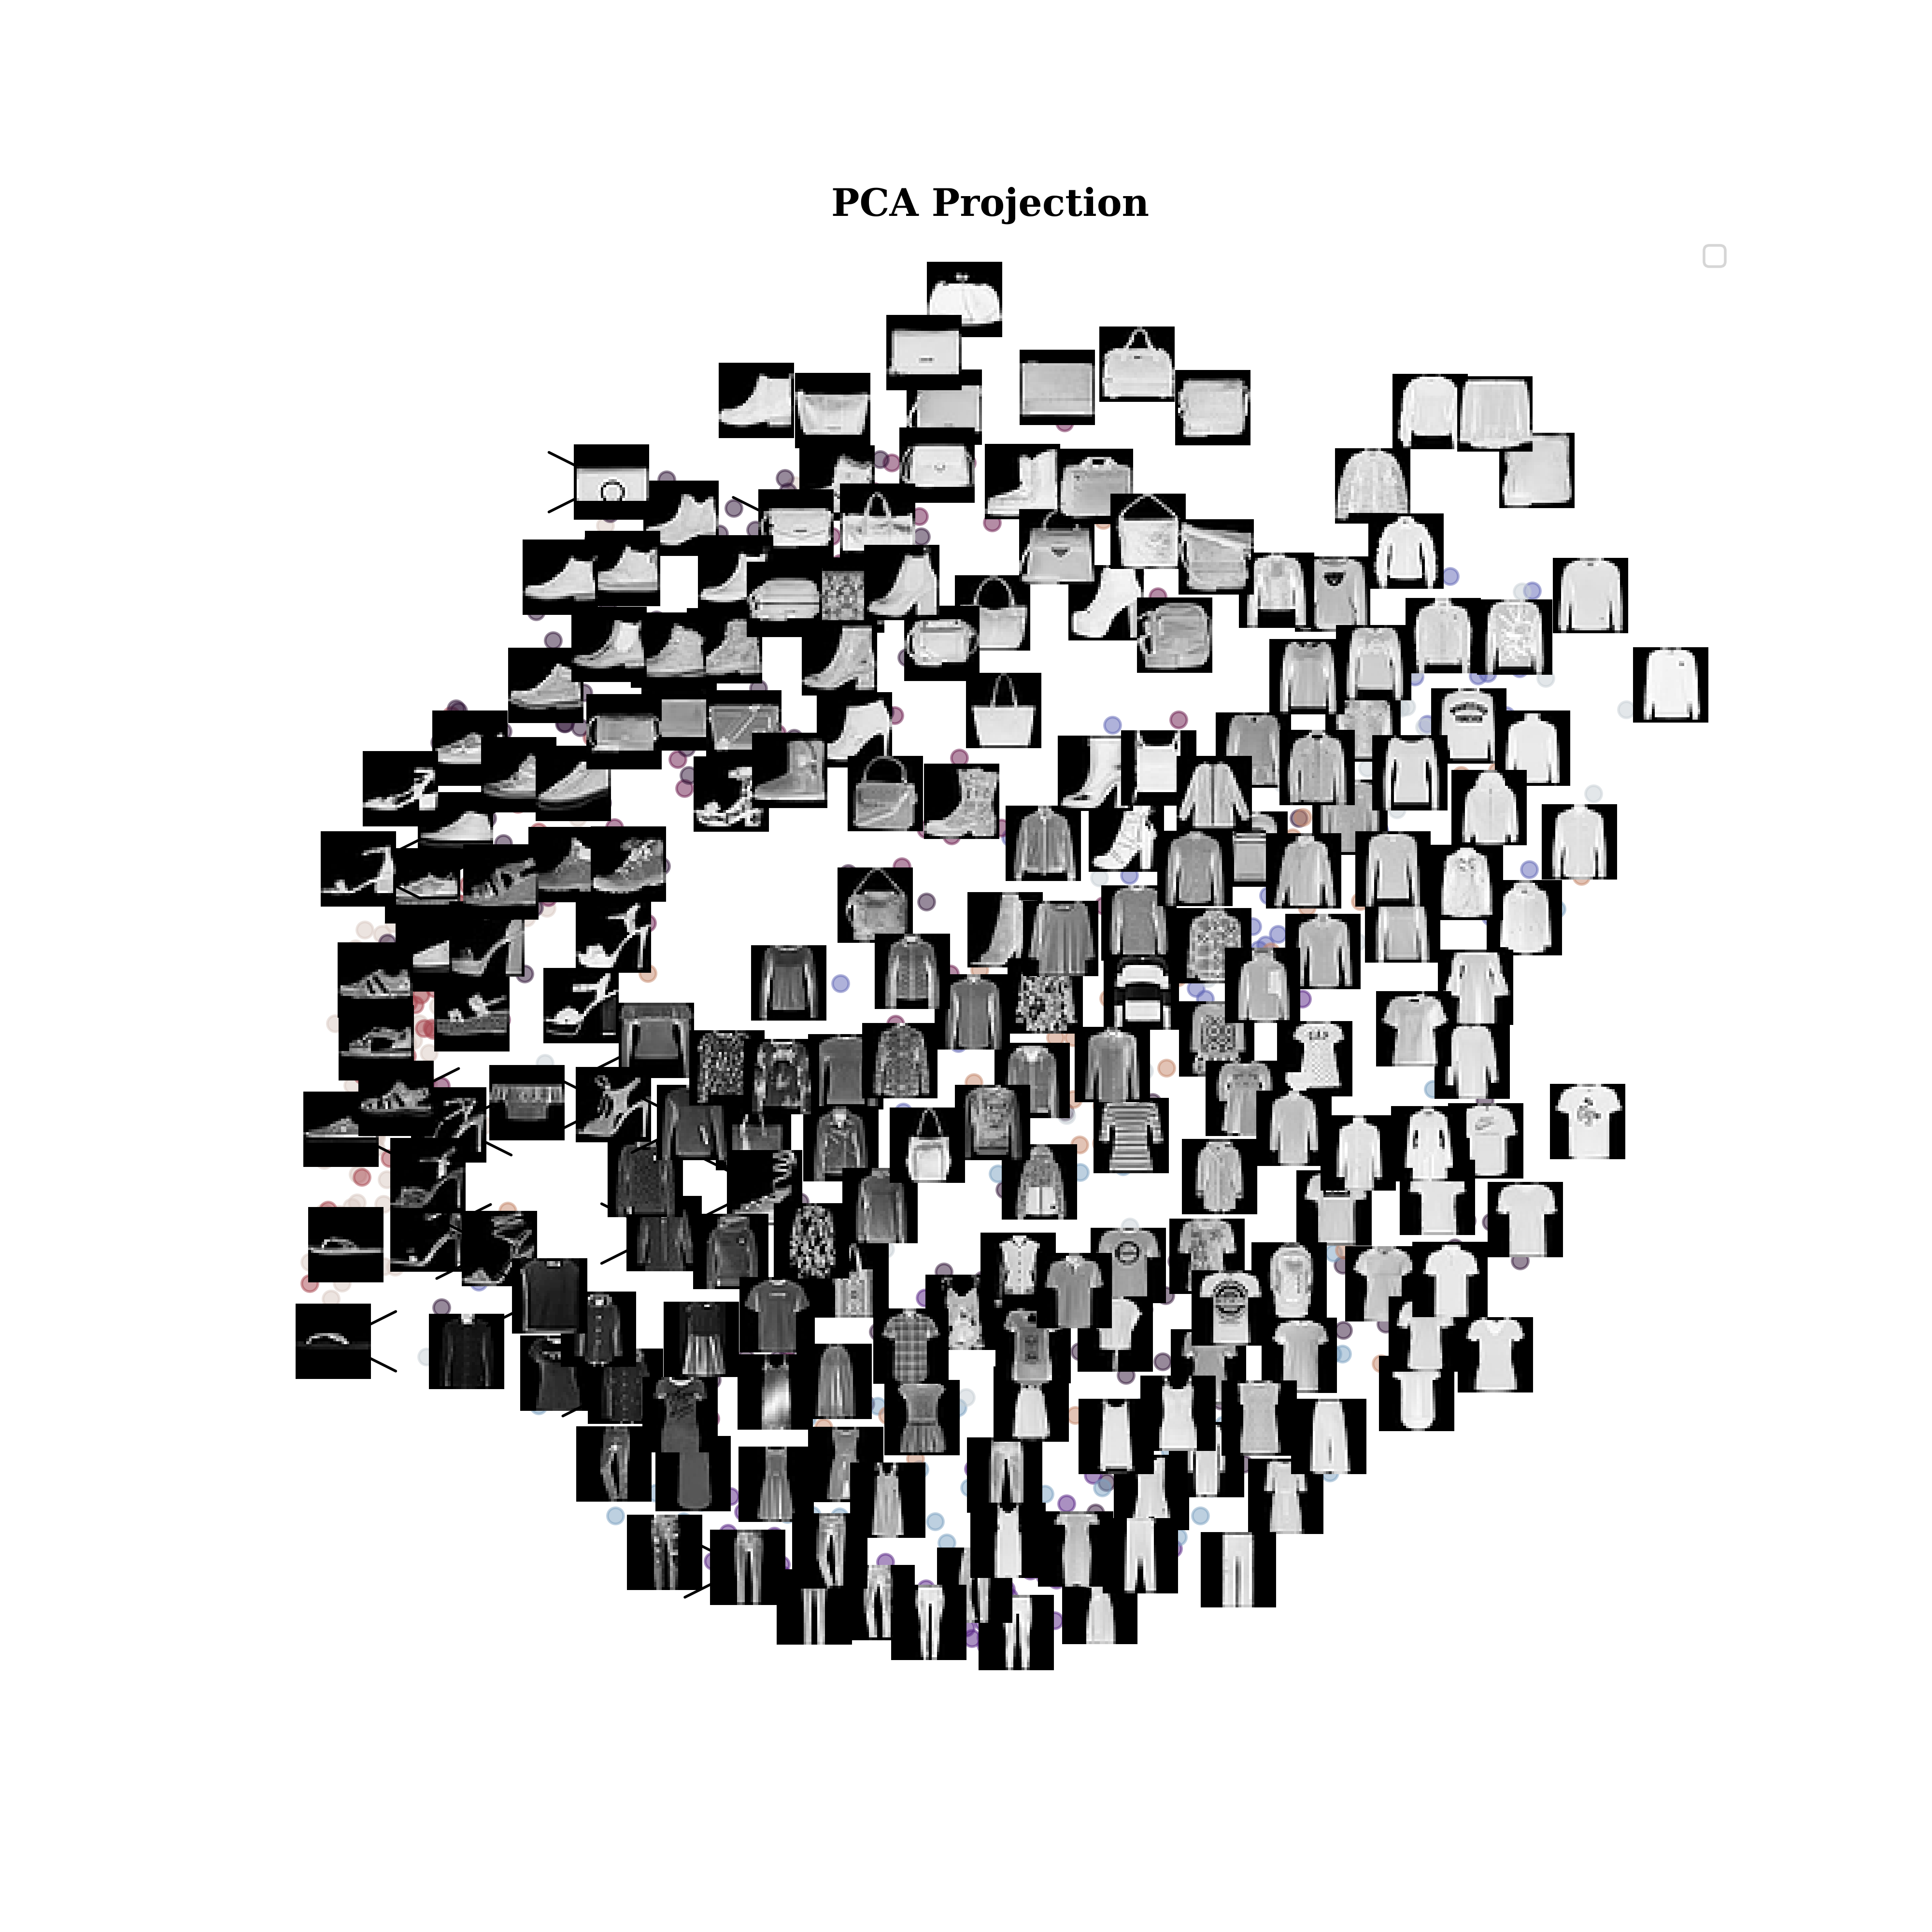
The FashionMNIST dataset consists of images representing various clothing types. To process this dataset, I first loaded the data, ensuring that each image was represented as an array of pixel values.
To reduce computational complexity, I applied Principal Component Analysis (PCA) to lower the dimensionality of the image data while retaining key features. This optimization significantly improved efficiency in model training.
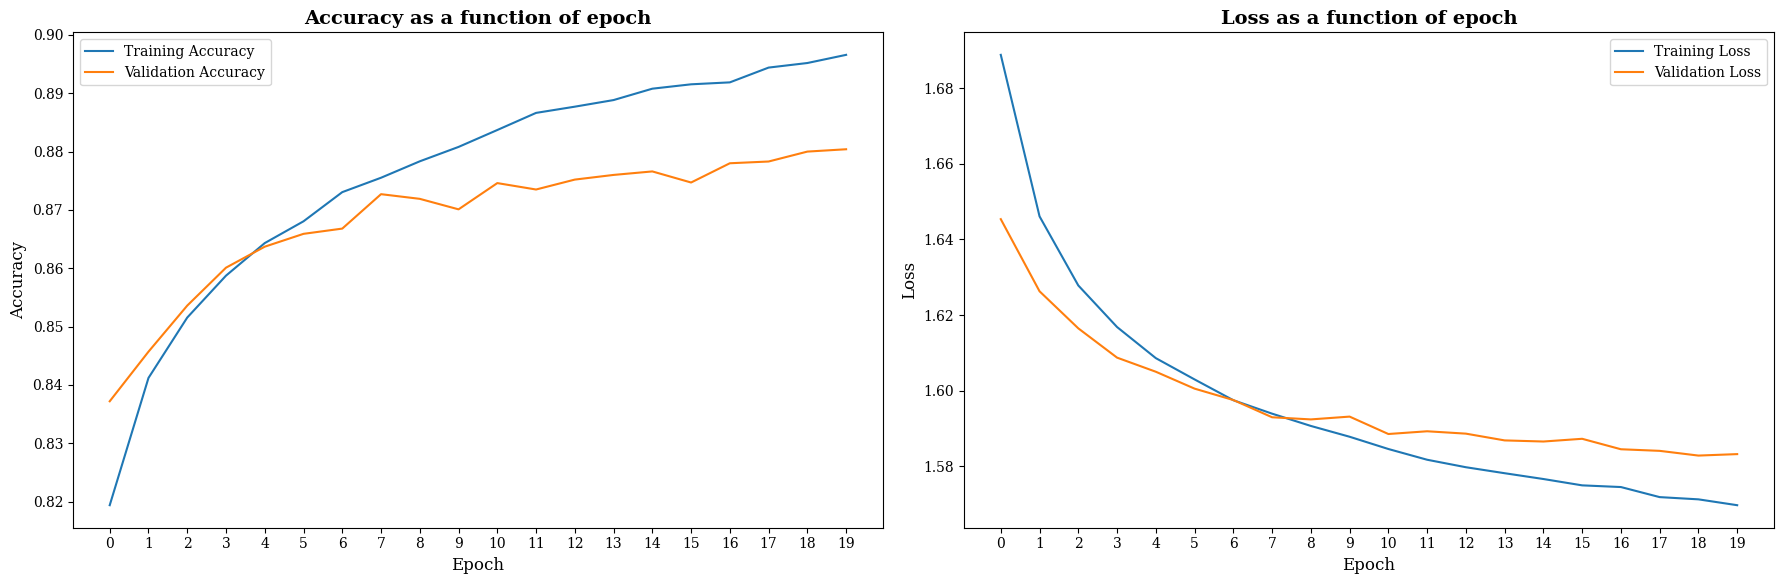
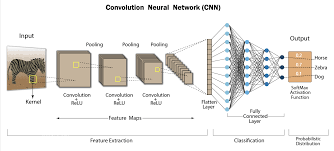
Using the processed dataset, I designed and trained a Convolutional Neural Network (CNN) to classify images into their respective clothing categories. After 20 epochs of training, the model achieved an 90% accuracy in correctly identifying clothing classes.
Credit Card Fraud Detection Using Ensemble Voting
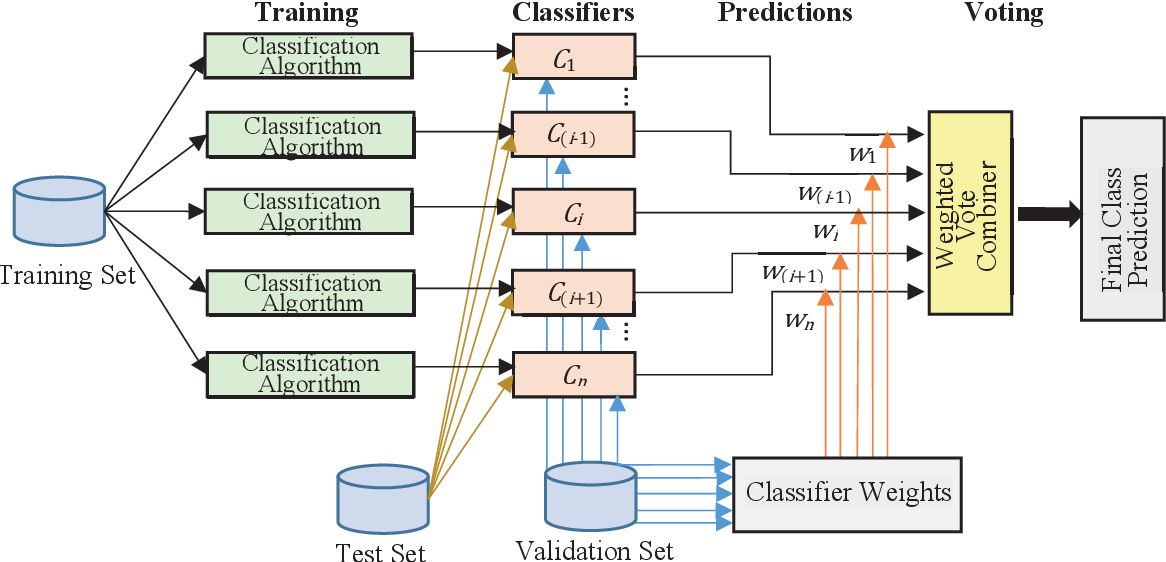
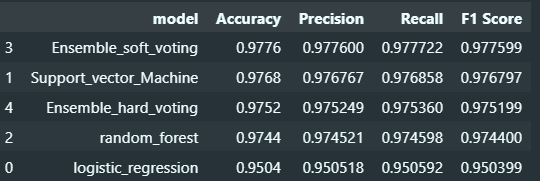
I trained and evaluated several classification models—including Support Vector Machines (SVM), Random Forests, and Logistic Regression—to identify fraudulent credit card transactions among European cardholders. To improve predictive performance and robustness, these models were combined using ensemble learning techniques.
While each individual model performed well, a soft-voting ensemble achieved the strongest results, reaching an overall 98% classification accuracy in fraud detection based on 14 anonymized input features.
It is important to note that the dataset contains highly informative features, and performance of this magnitude may not generalize to noisier, real-world environments. Nevertheless, this project provided hands-on experience with ensemble methods and model evaluation, offering practical insight into techniques commonly used in applied fraud detection systems.
The dataset used in this project was sourced from Kaggle: Credit Card Fraud Detection Dataset (2023) .